Platform Updates
Stay up to date with new features, improvements, and fixes across Aire Labs. Updates are organized chronologically, with the most recent changes at the top.April 3, 2026
Formula Editing from the Grid Modeling
You can now open the formula editor directly from any cell in the grid view. Click into a calculated term and edit its formula without navigating away from your model — keeping your place in the spreadsheet while you work.How to access: In the grid view, click any calculated term to open the formula editor inline.Formula History Tab Modeling
Every formula now has a full version history accessible directly inside the editor. See exactly how an expression has changed over time, who changed it, and when — without leaving the formula editor.How to access: Open the formula editor on any term and select the History tab.Improvements
- Formula editor polish — Improved modal layout, dark mode syntax highlighting, and cleaner display for large vector values that previously caused overflow.
- Sensitivity analysis blank state — The sensitivity analysis view now shows a clear empty state when no data has been configured yet.
- New formula functions —
findheader(),findancestor(), andassoc()are now available for more advanced lookup and navigation within your model. - New unit support — Added short ton, long ton, kBTU, GJ, volt-ampere, and apparent and reactive power units (VA through GVA and VAR through GVAR).
- Unit display aliases — Units now show familiar aliases (e.g. “MW” instead of internal canonical names), making the unit selector easier to read.
Bug Fixes
- The Escape key now reliably closes the formula editor.
- Autocomplete hints now show human-readable labels instead of raw internal IDs.
- The IRR/XIRR solver now converges correctly when the result is a negative rate.
March 27, 2026
Charts on Project Overview Research Preview
Pin charts directly to your project’s overview page for a persistent visual dashboard. Open a project and your key outputs are immediately visible — no navigation required. Currently available to select organizations as a research preview — contact support for access.- Add any saved chart as a widget from the overview page
- Arrange widgets by dragging them in the grid
- Charts update automatically as your model changes
- Supported chart types: waterfall, bar, line, stacked bar, tornado, KPI card
Cash Flow and Waterfall Charts Research Preview
Two new dedicated chart pages in Lab Bench for deeper financial visualization. Currently available to select organizations as a research preview — contact support for access.- Cash Flow Chart — Visualize project cash flows across your full timeline, organized by period.
- Waterfall Chart — Break down a financial output into its component contributions.
Improvements
- Clone scenario — Now prompts for a name and refreshes immediately — no manual reload required.
- Short-ton unit — Added
ton(short-ton) as a distinct unit, properly separated from metric ton to avoid aliasing errors. - Formula editor — Improved dark mode syntax highlighting and faster formula history loading.
Bug Fixes
- Vector values — Fixed overflow in the formula editor modal for long vector values.
March 20, 2026
Grid Mode Views
Grid Mode is a spreadsheet-style view of your entire model. It displays all terms across all blocks in a tabular layout, with formulas visible on hover and timelines pinnable as column headers — giving you the density and familiarity of a spreadsheet without leaving Aire.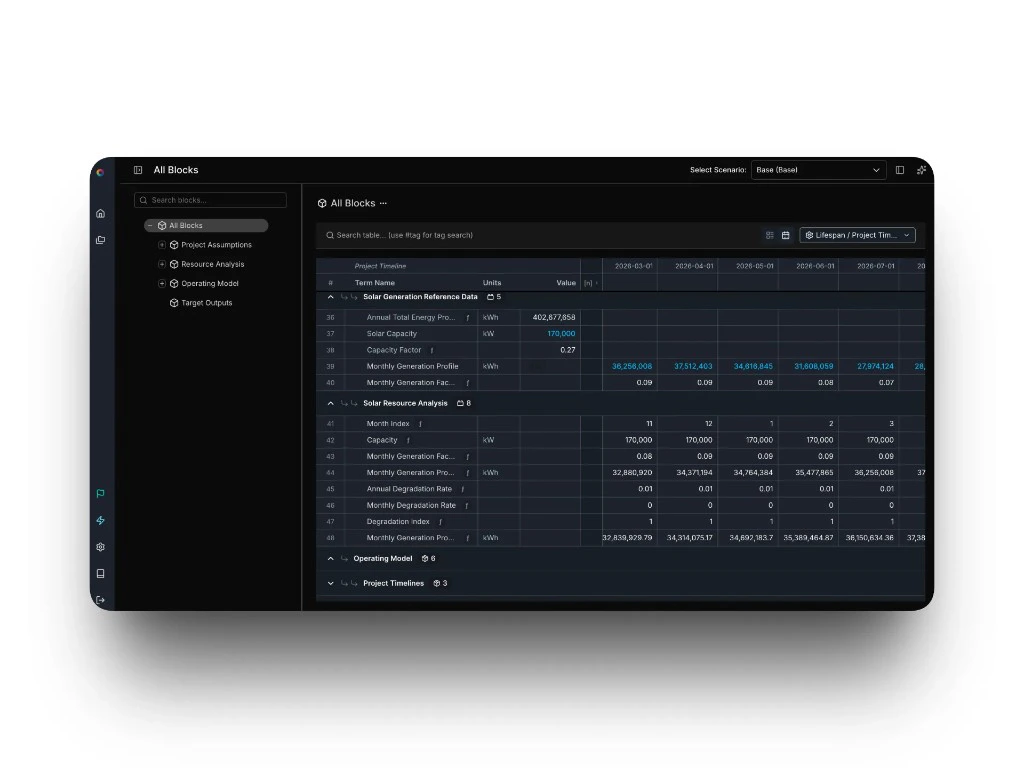
- Formula hovers show the full expression for any calculated term
- Scalar and array values display consistently in the same grid
- Pin timelines as grid headers for time-series navigation
Redesigned Project Home Platform
The project landing page has been redesigned to give you everything you need to orient and get moving. An editable project description, at-a-glance model stats, and navigation shortcuts are now front and center when you open a project.- Editable project description visible from the project home
- Model stats — term count, block count, and case count — displayed at a glance
- Navigation shortcuts to jump directly to key views
Improvements
- Collapsible side panels — Left-hand navigation menus and toolbars can now be collapsed to maximize workspace.
- Horizontal scroll always visible — The horizontal scroll bar is now pinned to the bottom of the all-blocks view for easier navigation.
Bug Fixes
- Formatting (currency $, percentages %, custom date formats like dd-mmm-yy) is now correctly applied to array and time-series terms.
March 12, 2026
New Features
- Container auto-rerun — Container blocks now re-execute automatically whenever a connected input changes, so your outputs stay in sync without any manual intervention.
- Container log viewer — Runtime logs for each container execution are now accessible directly in the app. Click any error node in your model to jump to the exact log line that caused it.
Bug Fixes
- Terms now land in the correct position when dragged, including across blocks and to the top of a block.
- Deleting a block no longer triggers a full page refresh.
- The horizontal scroll bar now stays visible when zoomed out.
- The unit selector is now available immediately when creating a new term.
- New terms now auto-focus the label field on creation.
March 5, 2026
New Features
- AI-assisted edits flagged in version history — When a change is made using the AI assistant, the version history now shows an “AI” tag on that entry — so your team can see at a glance which edits involved AI assistance.
Improvements
- Formula stays visible in error rows — You can now inspect the formula for a row even when it’s showing a calculation error, making it easier to diagnose and fix the problem.
- Fuzzy search for terms — Term search now uses fuzzy matching, so you get relevant results even when your query isn’t an exact match.
Bug Fixes
- Tag creation no longer commits before you’ve finished typing.
- Tables no longer rubber-band or snap back unexpectedly while scrolling.
- Extra whitespace above the header row no longer appears.
February 26, 2026
Improvements
- Shareable version URLs in project history — The selected scenario is now reflected in the URL, so you can share or bookmark a specific version comparison view directly.
- Change history search finds more — Search results now include terms matched by formula value and error state, not just label name.
- Change history is easier to read — Changed entries are visually highlighted, numbers display with proper formatting, and removed units and tags are identified by name instead of appearing blank.
- More accurate change history data — Project created and updated dates now reflect the correct timestamps, and percentage-based fields like discount rates no longer display incorrect currency symbols.
Bug Fixes
- Horizontal scrolling in the spreadsheet view now works correctly when the cursor is near sticky columns.
- Live collaboration sessions no longer stop syncing for active sessions.
- The Enter key now reliably re-enters edit mode after confirming a cell edit.
February 19, 2026
New Features
retime()— Maps a phase-scoped array to your full project timeline. If you have costs spread across 8 construction months,retime()automatically places them in the right positions across a 20-year model — no manual padding or repeated formulas needed.sumby()andunique()— Two new functions for working with categorized data.sumby()aggregates values by a matching category — sum costs by technology type, outputs by phase, and so on.unique()returns the distinct values from an array, useful when you need a clean list of categories to work with.- Smarter error recovery in the AI assistant — When the assistant encounters a formula error while editing, it now incorporates the error message into its reasoning and attempts to self-correct or explain what went wrong — reducing back-and-forth.
Improvements
- AI assistant chat auto-scrolls — The chat panel now scrolls to the latest response automatically after the assistant replies.
- Cleaner navigation breadcrumbs — Removed redundant organization and project name repetition from the main breadcrumb trail.
- Clearer drag-and-drop feedback — Moving a term now shows more distinct visual cues while dragging, making reorganization easier to follow.
Bug Fixes
- Clearing a term’s description or notes field now saves correctly without corrupting the model.
- “Last Updated” timestamps on the project overview page now reflect the correct time.
- Numbers in AI assistant responses now format correctly in markdown.
- Values in the version history side panel now display in full.
- Version history views now render correctly in dark mode.
- Date and timestamp column headers in version history are now correctly aligned.
February 12, 2026
Improvements
- Softer warning and alert colors — Warning banners and error indicators now use calmer, lower-contrast colors for a less jarring experience.
- Confirmation before deleting a view or analysis — Destructive actions now show a clear confirmation dialog.
- More intuitive tag creation — An empty tag area now shows a plus button that opens the existing tag picker, making it clear how to add tags to a term.
Bug Fixes
- Pressing Tab after confirming a table cell edit now moves focus to the next cell as expected.
- Blocks created from the left-hand navigation panel now appear in the “move term to” dropdown.
- Numbers in AI assistant responses now render correctly in all markdown contexts.
- Delete confirmation dialog text now displays with sufficient contrast to be readable.
February 5, 2026
Project History with Version Control Collaboration
Every change to your project is now automatically tracked and versioned. View a complete timeline of edits, compare versions, and restore previous states with a single click. Project History surfaces who changed what, when, and why — essential for audit trails and team collaboration.- Timeline view shows all model changes with timestamps
- Diff view compares any two versions side-by-side
- One-click restore to any previous state
- Automatic tracking requires no setup or manual saves
February 3, 2026
Redesigned Tables Views
Working with large models just got faster. Tables on All Blocks and Scenarios now keep headers visible as you scroll, so you always know what you’re looking at. Edit values directly in the table — no more opening sidebars for every change. Customize which columns you see, search to find specific terms instantly, and benefit from tighter spacing that fits more data on screen without sacrificing readability.- Frozen headers stay visible while scrolling horizontally
- Edit term values directly in the table
- Show or hide columns based on what you need
- Search to quickly locate terms in large models
- Denser layout fits more information on screen
- Blue text instantly identifies editable inputs
- Column settings persist automatically
January 28, 2026
AI-Powered Project Insights AI
Project AI now analyzes your entire model and generates natural language insights about financial performance, risk factors, and optimization opportunities. Ask questions in plain English and get answers grounded in your actual project data.- Natural language queries about any project metric
- Automated identification of key risk drivers
- Suggestions for model improvements and optimizations
- Context-aware responses reference specific terms and blocks
December 3, 2025
Source Documentation Modeling
Sources provide traceable references for every assumption in your model. Link terms to research papers, test data, manufacturer specs, or past projects. Build credibility and simplify due diligence with embedded documentation.- Attach multiple sources to any term
- Support for URLs, file uploads, and text notes
- Source badges visible in Assumptions view
- Filter and search by source type or citation